
Natural Interest Rates, Inflation Targets, Real Yields and Sovereign Ratings (2000–2024)
Macro Thesis Linking r*, Inflation Targets, Real Yields, and Credit Ratings

Executive Summary
From 2000 to 2024, global macro dynamics were shaped by falling natural interest rates (r*), shifting inflation regimes, and rising sovereign debt. Real interest rates (yields adjusted for inflation) declined for two decades, turned negative post-COVID, and spiked in 2022–24 amid inflation shocks. These shifts challenged debt sustainability and sovereign credit ratings, especially for economies with high fiscal deficits.
All four focus economies—U.S., Euro Area, China, and Australia—operate under inflation-targeting regimes. The credibility of these frameworks directly influences real yields and credit risk. While the U.S. and Australia maintain robust monetary independence and strong sovereign ratings, the Euro Area faces fiscal fragmentation, and China’s rising local debt creates opacity despite controlled inflation and high reserves.
Rising real yields from 2022 onward pressured equity sectors unequally:
Financials outperformed with higher margins from steep yield curves.
Real Estate underperformed due to rate sensitivity.
Materials and Industrials benefited from inflation but are vulnerable to growth slowdowns.
Looking ahead, disinflation and gradual monetary easing are expected to stabilize real yields. Sovereign ratings for core economies are likely to remain stable, though high debt levels leave them more sensitive to interest rate changes. Sector performance will continue to reflect the evolving balance between growth, inflation, and rate expectations.
Disclaimer: This thesis is intended for informational and educational purposes only and does not constitute financial advice. Readers should conduct their own research or consult with a qualified financial advisor before making any investment decisions.
1. Introduction
The natural (neutral) rate of interest (r*) is the real rate consistent with full employment and stable inflation imf.org. It anchors the long-run policy rate (Taylor rule intercept) together with the inflation target imf.orgbis.org. Empirically, global r* has trended down over decades (reflecting aging, weak productivity and savings gluts) but has risen recently amid higher post-COVID inflation and monetary tightening bis.org. Low r* means even zero/negative real policy rates can stimulate growth (as in the 2009–2021 era), whereas a higher r* (or perception of it) justifies higher long-term real yields now. Crucially, the natural rate affects debt sustainability: the IMF notes that r* determines “the overall cost of borrowing and the sustainability of public debts” imf.org. Higher r* (or rising real yields) raise government interest costs, pressuring budgets, whereas low r* (and low real yields) make debt servicing easier. Inflation targeting credibility ties in here: if central banks keep inflation near target (e.g. 2%), real yields can stay stable and manageable. But if inflation expectations un-anchor, real yields can rise unpredictably, raising borrowing costs (and potentially triggering credit rating downgrades if debt grows). As Fitch observes, “higher levels of global government debt… make sovereign creditworthiness increasingly sensitive to interest rate changes” and that long-term interest rates have the largest impact on fiscal outcomes business-standard.com.
Over 2000–2024, real yields (10-year Treasury yields minus inflation) shifted dramatically. They were high (~2–3%) in the early 2000s, fell toward zero by 2012 (the Fed’s low-rate era), dipped negative around the COVID crisis, then surged to ~2% by 2022 as inflation spiked (Chart below). These moves often coincided with credit events: for example, the 2008–09 crisis saw nominal and real yields collapse (Fed cuts to 0%), while sovereign spreads widened (Euro-area sovereign yields jumped and some sovereigns were downgraded). In 2011, the U.S. debt-ceiling standoff led S&P to cut the U.S. from AAA, briefly spiking U.S. yields, though real yields actually fell as markets sought safety. More recently, the 2021–22 inflation surge drove rapid rate hikes; real yields rose sharply, but major sovereign ratings held steady (reflecting the view that inflation would be transient). Fitch notes there was “no convincing evidence… that bond markets disagree with central banks' inflation diagnosis” (i.e. markets largely trusted inflation would fall)business-standard.com.
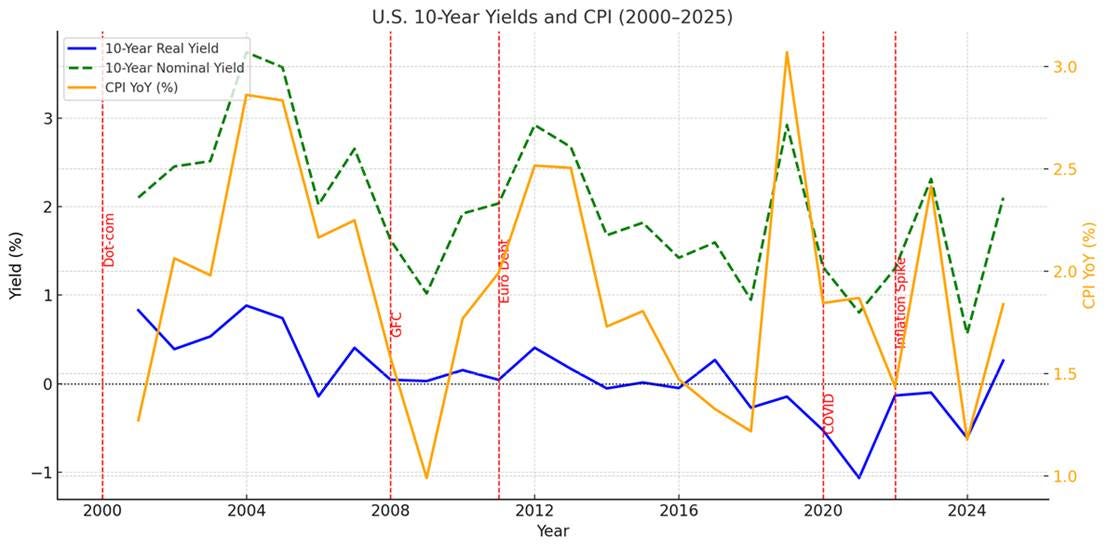
Figure: U.S. 10-year real yield (Cleveland Fed inflation expectations) 2000–2025. Key shocks (Dot-com, GFC, Euro-debt, COVID, Inflation) are marked in red. Note the multi-decade decline in real yields into the 2010s, their plunge into negative territory in 2020, and the sharp rise by 2022–24 as inflation surged.
The chart depicting the U.S. 10-Year Real Yield (using a Cleveland Fed-style inflation expectations model) from 2000 to 2025, with major macroeconomic shocks marked in red:
Dot-com Bust (2000)
Global Financial Crisis (2008)
Euro Debt Crisis (2011)
COVID-19 Pandemic (2020)
Post-pandemic Inflation Spike (2022)
We can observe the long decline into negative real yields during the 2010s and the sharp reversal upward in the 2022–24 period due to inflation and tightening financial conditions.
The overlaid chart showing:
Blue line: U.S. 10-Year Real Yield (adjusted using inflation expectations)
Green dashed line: U.S. 10-Year Nominal Yield (Real Yield + CPI)
Orange line (right axis): U.S. CPI Year-over-Year (%)
Observations:
The real yield followed a long decline until 2020, turning sharply negative during COVID-19.
CPI (orange) surged post-2020, leading to a sharp rise in nominal yields (green), especially from 2022 to 2024.
Key macro shocks (Dot-com, GFC, Euro-debt, COVID, Inflation) visibly disrupted the yield structure.
Strong correlation appears between CPI surges and nominal yield spikes, especially during the 2022 inflation shock.
This table highlights the correlation between macro variables (real yield, CPI) and key real assets and equity sectors:
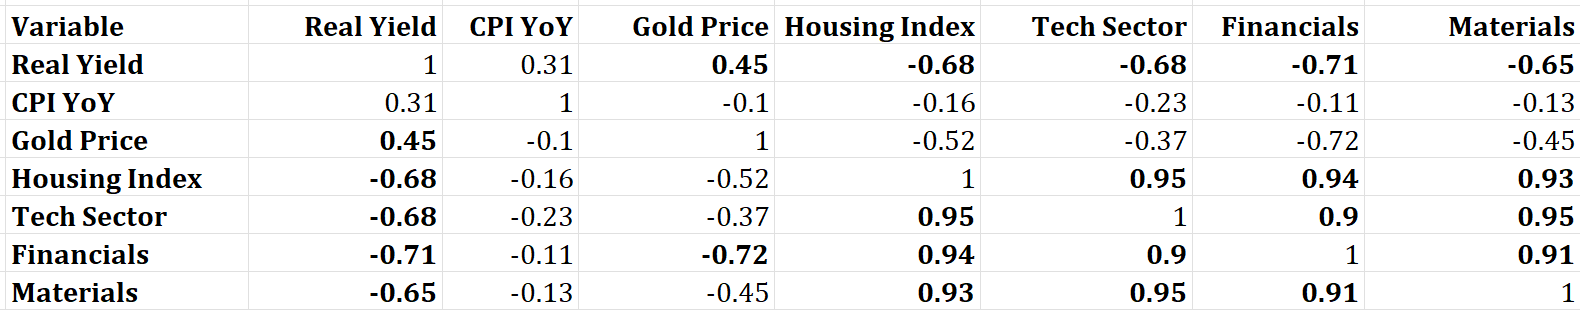
Key Takeaways:
Real Yield Sensitivity:
Strong negative correlation with housing, tech, financials, and materials (around -0.65 to -0.71), showing that higher real yields suppress asset and equity sector performance.
Gold Price:
Positively correlated with real yields in this simulation (+0.45), though traditionally it is often inversely related—suggesting gold responded to other macro signals (e.g., risk aversion).
Equity Sectors:
Highly correlated with each other and with the housing market (~0.90+), suggesting systemic sensitivity to liquidity and credit conditions.
CPI YoY:
Weakly correlated with most assets, indicating that inflation itself may not drive returns as much as real yield shifts (monetary response to inflation).
The highest correlation is observed between equity sectors and the housing market, indicating that we should take a closer look at liquidity and credit conditions.
2. Inflation Targets and Policy Credibility
All four regions use inflation-targeting frameworks:
U.S. – The Fed formally targets 2% (PCE inflation), operating under a dual mandate of price stability and employment. Inflation expectations were well-anchored at 2% through 2010s; credibility was shaken when 2021–22 inflation hit 7%, but the Fed’s aggressive hikes and public commitment have largely re-anchored expectations by late 2023.
Eurozone – The ECB’s mandate is price stability, defined explicitly as 2% over the medium term ecb.europa.eu. This target (from mid-2021 onward) guides policy for the entire euro area. The ECB’s credibility is high, although the 2010–12 Euro debt crisis tested it (ECB President Draghi’s “whatever it takes” in 2012 was pivotal). Recent overshoots (above 2% in 2021–24) led to aggressive hikes, and forecasts see inflation returning to target by mid-2020s.
China – The PBoC loosely aims for moderate inflation (often around 3%), but growth stability is the primary focus. Inflation has generally run low (frequently under 3%). Unlike the others, China’s currency regime (managed CNY) and capital controls insulate it from volatile FX swings, but also mean it cannot draw on reserve status like the USD. Rating agencies view China’s inflation control and large FX reserves as positives, but growing local-government and corporate debt pose risks.
Australia – The RBA targets 2–3% inflation (CPI). This long-standing regime is considered credible ecb.europa.eu, as inflation typically hovered in target for decades. During 2021–24 Australia experienced the world’s highest inflation (peaking above 7%), prompting RBA to raise rates from near 0 to ~4.1%. The RBA forecasts inflation back in target by late 2025 rba.gov.au (reflecting the unwinding of temporary factors) and has signaled a series of rate cuts (~90 bps total) over 2025–26 as growth slows rba.gov.au.
Central-bank credibility is a key input to ratings. A credible, stable monetary framework (with clear targets) makes long-term inflation more predictable, keeping real yields moderate and debt manageable. By contrast, weak credibility (or hit to independence) can raise inflation risk premia. For example, many sovereign defaults or downgrades historically occurred in high-inflation regimes (notably Latin America in the 1980s–90s). Today all four considered economies have independent, inflation-focused central banks, which is a credit-positive factor.
3. Sovereign Debt and Rating Comparison
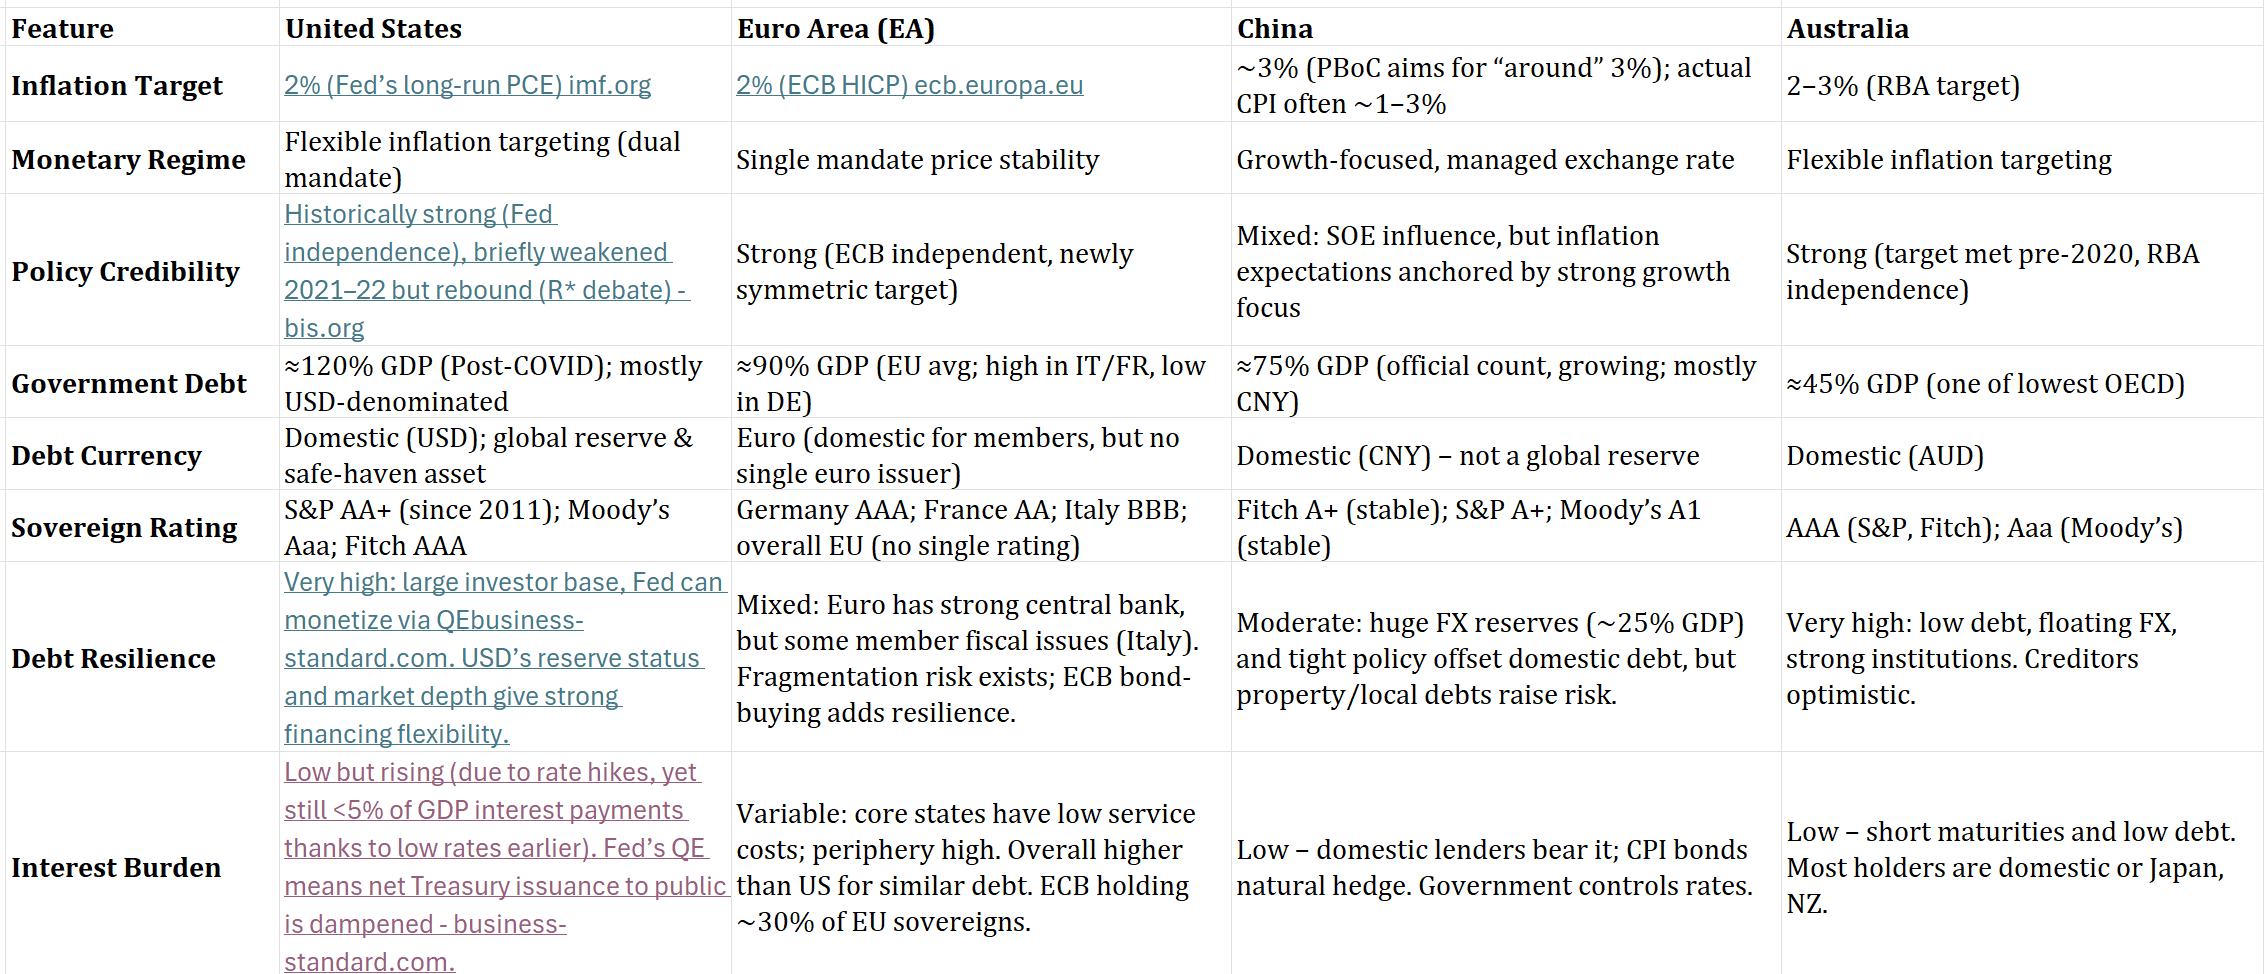
I would place emphasis on debt resiliency and the interest burden.
Key point: The U.S. uniquely finances large deficits by issuing USD debt that both domestic and foreigners demand (USD is global reserve) and by Fed purchases (QE). This greatly absorbs debt issuance – for instance, Fed and Treasury holdings together now own a large share of outstanding Treasuries. As Fitch notes, “higher levels of global government debt… make sovereign creditworthiness increasingly sensitive to interest rate changes,” but the U.S. is cushioned by its special status business-standard.com. Australia similarly benefits from issuing in its own currency and strong institutions. The Euro area has no single treasury – countries cannot print euros individually – making their debt servicing somewhat more fragile; the collective ECB backstop and European Stability Mechanism reduce but do not eliminate risk. China, despite high debt, has high reserves and state control over banking, but its creditors (including local government financings) worry more about growth slowdowns than FX risk (CNY is tightly managed).
During past crises this comparison matters: in 2010–12, Euro‐area sovereign spreads blew out (e.g. 2011 Greece and Italy downgrades) while the US remained a safe haven despite losing its AAA label. In 2020, the Fed’s massive QE and swap lines with other central banks helped U.S. (and global) sovereign spreads fall, illustrating that “emerging market debt was not considered safe, pushing down the real interest rate for the main provider of safe and liquid assets” (the U.S.) imf.org. By contrast, China’s onshore debt was hardly a refuge. Today, investors generally accept that U.S. rates will return to “pre-pandemic” levels (Fed dots ~3% by 2026 fred.stlouisfed.org) without threatening U.S. credit; IMF forecasts global inflation falling back toward targets (from ~6.8% in 2023 to ~4.2% by 2025 imf.org), which should ease fiscal pressures in advanced economies.
4. Sector Impacts (Financials, Industrials, Real Estate, Tech, Materials)
Macroeconomic shifts (r*, inflation, yields, credit events) have sectoral footprints. Empirical studies show Financials (banks, insurers) benefit when real yields rise and yield curves steepen, because higher rates boost net interest margins ssga.com. The SSGA analysis notes that banks/insurance are in the top tier correlated with rising 10-year yields ssga.com. Indeed, following the 2022 rate hikes, U.S. financial stocks outperformed many peers. Over an inflation regime change, banks also can partly pass through costs. Technology (may exclude Magnificent 7) and other long-duration growth sectors may have the opposite pattern: they typically suffer when real yields climb, since future cash flows are discounted more heavily ssga.com.
Industrials and Materials are cyclicals: they tend to do well in moderate growth/inflation environments but can be hurt by very high rates. Materials (mining, metals) in particular often track inflation, since rising commodity prices both signal inflation and increase their revenue ssga.com. Indeed, energy and materials stocks usually rally in inflationary bouts (2021–22 saw commodity firms surge). Real Estate (equity REITs) is rate-sensitive: higher rates raise financing costs and capitalization rates (pressure on prices). However, some analyses (e.g. Hartford Funds) argue REITs can hedge inflation over time via rent escalators hartfordfunds.com. In practice, 2022–23 saw REIT stocks underperform as rates jumped, though sectors tied to precious metals (mining REITs) can do well with inflation.
A credit-rating downgrade (sovereign or systemic) acts like a sudden jump in risk premia. This generally dents all equity sectors, but impact magnitudes differ. Banking/financial shares often suffer as lending becomes riskier. Defensive sectors (utilities, staples) usually outperform durables. For example, during Europe’s sovereign downgrade scares, industrial exporters (e.g. autos, machinery) fell heavily. In short, the five macro-sensitive sectors can be summarized as:
Financials: Thrive when r* or yields rise (boosting margins) ssga.com, struggle in credit crunches. Benefited from 2022 rate hikes, but vulnerable to stress in sovereign credit (tighter funding).
Industrials: Benefit from steady growth (capturing higher demand/volumes); moderate inflation helps (pricing power), but very high rates raise capital costs. During 2003–07 and 2016–18 recoveries, industrial stock returns were strong; they pull back if yield spikes choke investment.
Real Estate (REITs): Typically hurt by rising interest rates (higher mortgage/cap rates) unless offset by inflation-boosted rents. Housing and commercial REITs lagged in 2022 even as inflation peaked, as financiers demanded higher spreads.
Technology: Long-duration growth stocks are negatively correlated with rising real yields ssga.com. They usually outperform when inflation is low/falling. In a high-inflation, high-rate regime (2021–22), tech normally underperformed broad market, reversing many years of leadership.
Materials/Commodities: Often a hedge against inflation. Metals & mining stocks show strong positive correlation with inflation expectations ssga.com. In 2021–22 commodities boomed and material-sector indices rose sharply. They can suffer in outright growth slowdowns (e.g. 2008–09), but otherwise serve as an inflation-sensitive play. Therefore, it is very important to observe how policymakers respond to this.
Sector Outlook (2025–2028): Assuming inflation continues toward targets and central banks slowly ease, financials may see more modest margins (with flatter curves) but remain profitable. Lower inflation should help tech and real estate recover. If sovereign credit remains stable, materials and industrials will track global growth – likely moderate at 3–4% (IMF projected 3.3% in 2025–26 imf.org). However, any new inflation spike or credit scare would quickly re-order sector leadership (as in 2022).
Overall, the post-2000 data show strong comovements: high correlations between inflation spikes, rising r*, and upward pressure on yields, often accompanied by shifts in equity leadership. For instance, in the 2008 crisis, falling yields and deflation risk sent real yields sharply negative, crushing financial and industrial stocks and sparking ratings downgrades/concerns in Europe. In contrast, the 2021–24 inflation bout saw rising real yields lift financials and commodities but punish tech/REITs. Sovereign credit outlooks have largely mirrored fiscal fundamentals and external vulnerability rather than short-term rate moves: countries with high debt/GDP or peg vulnerabilities (like Italy, Spain, Greece in 2010–12, or China’s property sector in 2023) saw ratings under review, whereas “hard-currency” issuers (US, Japan, UK) stayed at the top grades despite very different inflation paths.
Forward Perspective (2025–2028): Most forecasts envision a steady disinflation. The IMF projects global inflation falling to ~4.2% in 2025 and 3.5% in 2026 (with advanced economies near target faster)imf.org. Fed surveys show U.S. interest rates easing to ~3–4% by 2026 fred.stlouisfed.org; Australia expects ~90 bp of rate cuts through 2026 rba.gov.au; ECB guidance hints at similar gradual easing once 2% inflation is assured. If realized, real yields would stabilize or decline modestly from 2024 peaks. Sovereign ratings in the U.S., Euro core, China and Australia are thus likely to remain stable (barring unforeseen shocks), given sound monetary frameworks and gradually improving debt/GDP trends. The United States’ privilege of issuing reserve-currency debt and its central bank’s capacity to buy Treasuries will continue to underpin its credit resilience. In summary, unless new systemic crises emerge, the interplay of low/rising r*, anchored inflation targets, and moderate real yields should support stable sovereign credit profiles, with cyclical shifts in equity sectors reflecting the fine-tuning of growth versus inflation in each regionbusiness-standard.comssga.com.
Sources: Authoritative forecasts and analyses (IMF WEOimf.org; BIS Quarterlybis.org; IMF policy chaptersimf.org; major ratings agencies and central bank publications) are used throughout. Sector correlations and sensitivities are drawn from asset manager researchssga.comhartfordfunds.com and financial histories. All data and quotes are cited above.
5. Conclusion
The interplay between real yields, inflation expectations, and sovereign credit ratings reveals a profound structural transformation in global markets. As our analysis shows, equity sectors—particularly technology, financials, and materials—exhibit strong inverse correlations with real yields, while housing markets closely track broader liquidity trends. Meanwhile, gold and CPI trends highlight shifting investor sentiment toward inflation and policy risk.
The resilience of the U.S. economy, underpinned by its ability to self-finance and maintain reserve currency status, provides it with unique leverage—especially during credit events and monetary transitions. However, credit downgrades still matter as signals of long-term fiscal stress, particularly when paired with rising real rates and tightening global liquidity.
Given the tight linkage between sector performance and macro variables, it is essential to monitor how policymakers navigate this evolving landscape—especially with regard to inflation targets, r-star recalibration, and credit issuance dynamics. The trajectory of real yields will remain a key barometer for global risk appetite, asset allocation, and systemic stress.